Test-Pin Inspection & Lifecycle Control
Turn carrier status from "visually checked" into "quantitatively confirmed."
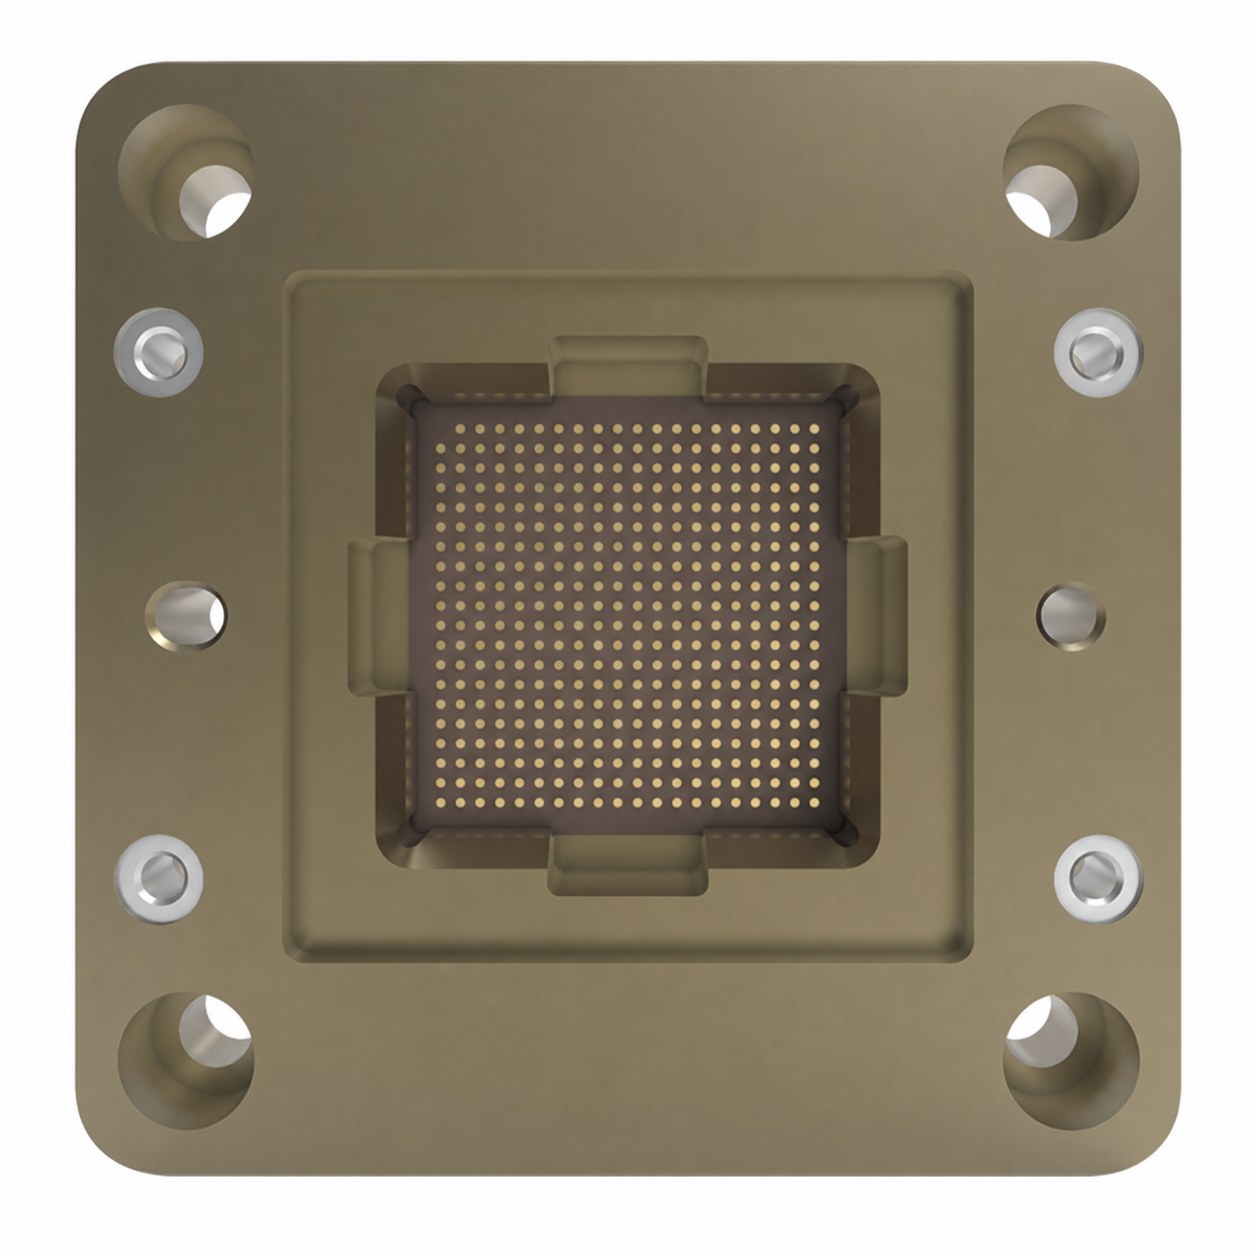
Test carriers keep evolving toward higher bandwidth, finer pitch, and higher pin counts — and pin consistency directly bounds yield and test stability. Insightek quantifies pin height, coplanarity, positional offset, and surface condition pin by pin, across high-density test-pin arrays and test sockets.
Three reasons this holds up on the test floor.
Multi-view imaging, 3D profiling, and AI classification
A microscope cannot quantify a full pin array. Multi-view imaging, 3D profile metrology, and AI surface-state classification measure pin height, coplanarity, pitch, and surface condition pin by pin — and return anomaly coordinates, not an impression.
Quantified verdicts you can verify
Models are trained on your own carrier samples, and overkill and escapes are accepted against a jointly agreed sample set. Every metric on this page discloses its definition and calibration, so your engineers can check it independently.
Phased adoption, controlled risk
Start from sample validation and offline checking, then decide on line-side integration and standard equipment. Software, integrated unit, and full machine are three delivery tiers, each with clear deliverables at every step.
Why one test pin decides whether a batch passes.
Test-pin arrays share the same trap as micro-holes and dicing edges: huge pin counts, tiny defects, and gradual degradation that low-coverage sampling and manual inspection are poor at catching.
One bad contact means a full-batch retest.
A single missing, bent, or collapsed pin — or one out-of-spec contact — can force a full-batch retest and line downtime. The cost of an escape multiplies the further downstream it is caught.
A microscope cannot quantify a full array.
Manual and microscope checks are subjective and cannot produce pin-by-pin numbers across hundreds of pins. Local drift on a few pins is exactly what sampling misses.
Contact stability degrades gradually with use.
Pin height, coplanarity, wear, and contamination drift with insertion cycles. Without a quantified trend, cleaning frequency and pin-replacement thresholds are set by guesswork.
Post-maintenance confirmation is slow.
After cleaning or pin replacement, confirming the carrier is fit to return to the line is slow and prone to misjudgment when it relies on the eye alone.
Five steps, a deliverable at each gate.
You bring representative carriers and target metrics; Insightek closes each step with a concrete document, so line-side integration and equipment are decisions you make on evidence, not on a promise.
- 01
Sample & process review
You provide representative carriers (good, abnormal, and borderline pins) and target metrics; Insightek assesses feasibility. You receive a feasibility conclusion.
- 02
Imaging & algorithm validation
Insightek selects the optics and validates the imaging and measurement models on your samples. You receive a detection and metrology demo report.
- 03
Inspection items & thresholds
Verdict thresholds and acceptance criteria are agreed together on a confirmed sample set. You receive a verdict scheme plus acceptance criteria.
- 04
Line-side integration & data output
Interfaces are hooked up, pilot runs are executed, and takt is confirmed. You receive an integration validation report.
- 05
Acceptance, replication & iteration
Formal acceptance, replication across carriers and lines, and model iteration that reduces overkill and escapes. You receive an acceptance report and a maintenance plan.
What to prepare: sample carriers (good / abnormal / borderline / re-judgment results), target metrics, the process context, interfaces, and acceptance rules.
Every pin, quantified — array, profile, position, and surface.
High-density test-pin arrays and test sockets, with pin height, coplanarity, positional offset, and surface condition measured pin by pin.
Array integrity
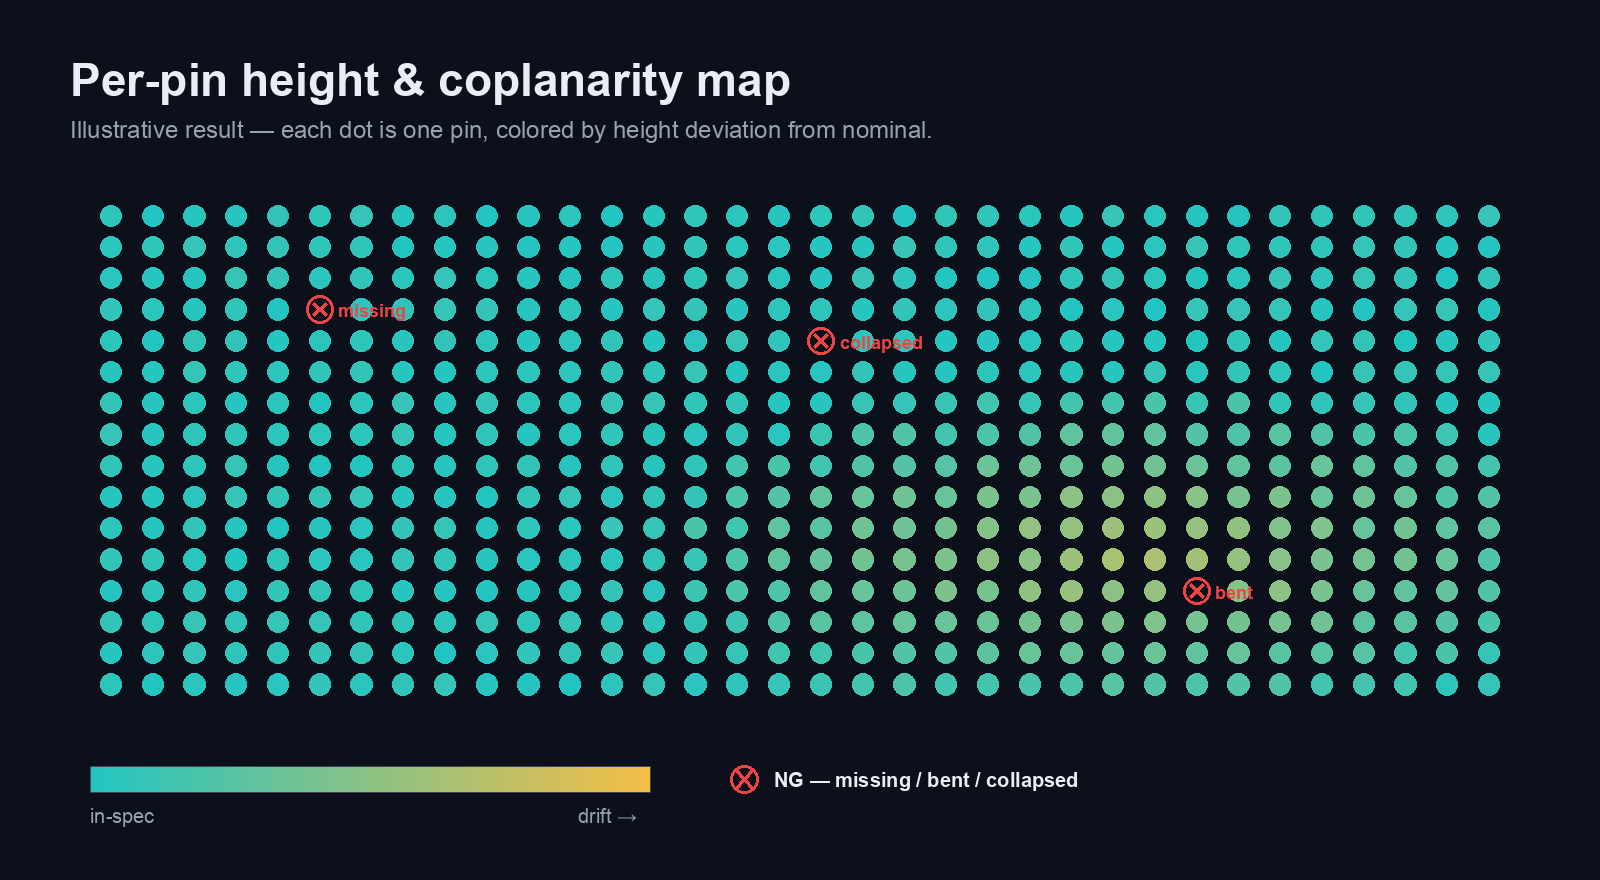
Detects the failure modes that break a whole contact array, located pin by pin so a technician knows exactly which pin to address.
- Missing, broken, bent, and collapsed pins
- Per-pin anomaly coordinates across the full array
- Array map so a single bad pin is not lost in the count
Pin height, coplanarity & flatness
3D profile metrology quantifies the geometry that governs whether every pin makes reliable contact under load.
- Pin height and coplanarity across the array
- Flatness of the contact plane
- Contact-stability indicators tracked over insertion cycles
Pitch & offset deviation
Positional consistency of the array — how far each pin sits from where it should be, which matters most on fine-pitch carriers.
- Pitch and positional offset per pin
- Suited to fine-pitch arrays down to the confirmed limit
- Deviation flagged against the agreed threshold
Wear, contamination & plating anomalies
AI surface-state classification reads the condition of each pin tip so degradation is caught as a trend, not after it causes an escape.
- Wear, contamination, and plating anomalies classified per pin
- Trends that inform cleaning frequency and replacement thresholds
- Models trained and refined on your own carrier samples
Scope & boundaries
Built for the checkpoints across a carrier's working life, and confirmed against your carriers before it goes into use.
- Use scenarios: pre-use check, post-cleaning re-inspection, pin-replacement acceptance, and periodic audit
- Fits BGA, LGA, QFN, PoP, strip, WLCSP, and other test carriers
- Fixturing and the exact measurable pin types are confirmed on your actual carriers during adoption
From a subjective look to a quantified record.
Quantify a full array a microscope can't
The problem: a microscope cannot quantify a full pin array. What the system does: multi-view imaging, 3D profiling, and AI classification. What you get: per-pin anomaly coordinates and quantified reports.
Turn gradual degradation into a trend
The problem: contact stability degrades with insertion cycles. What the system does: tracks pin height, coplanarity, wear, and contamination trends. What you get: cleaning frequency and pin-replacement thresholds informed by data.
Confirm maintenance faster, with less misjudgment
The problem: post-maintenance checks are slow. What the system does: before/after comparison with re-inspection reports. What you get: faster confirmation and lower misjudgment risk.
Typical values, with the definition and calibration behind each.
These are typical figures for the test-pin line — every one is stated with how it is defined and how it is calibrated on your carriers, so your team can verify rather than take our word.
| Metric | Typical value | Definition & calibration | Acceptance recommendation |
|---|---|---|---|
| Target | Sockets · WLCSP · Kelvin arrays | Pins and sockets on high-density test carriers; the exact scope and measurable pin types are confirmed on your samples. | Fixturing and measurable pin types confirmed on actual carriers during adoption. |
| Key items | Coplanarity, pin height & contact stability | Measurement repeatability is the ±3σ dispersion of repeated measurements at the same position on the same carrier; GR&R is calibrated on your carriers and written into the technical agreement. | Thresholds set on a mutually confirmed sample set, with contact-stability tracked over insertion cycles. |
| Pitch | ≥ 0.35 mm | Detection capability is the smallest deviation stably resolvable; calibrated with your fine-pitch and borderline samples. | Detection-limit, overkill, and escape criteria set on a mutually confirmed sample set. |
| Output | OK/NG + reports | OK/NG verdicts with per-pin coordinates, deviations, and defect classes, plus array maps and anomaly heatmaps with traceable re-judgment. | Reports and trends for repair comparison and life trend, delivered as CSV, images, or a custom format. |
Values shown are typical and depend on carrier type, pitch, and compute configuration. Fixturing and the exact measurable pin types are confirmed on your actual carriers during adoption. Every published metric is explainable, calibratable, and verifiable — we agree the method, not just the number.
Three delivery tiers, adopted in phases with controlled risk.
Software solution
Start hereModels, inspection platform, and interfaces for offline validation and integration with your existing setup — the lowest-commitment way to start.
- Inspection and metrology models
- Inspection platform and data interfaces
- Offline validation before any line-side commitment
Integrated hardware-software unit
Algorithms bundled with an AI compute box and industrial integration, for teams that want the compute and imaging delivered as one unit.
- Algorithms plus a dedicated AI compute box
- Industrial integration for the inspection station
- A step up from software once offline validation lands
Standard equipment
Full line-sideA full machine with the AI inspection system and a closed data loop, for line-side or inspection-station deployment.
- Full inspection machine
- AI inspection system built in
- Closed data loop back to your systems
Output is a per-pin quantified report with anomaly heatmaps and trend data — traceable to each pin, ready for repair comparison and life-trend tracking, and deliverable as CSV, images, or a custom report format.
What test teams ask first.
We already run AOI — is this still needed?
How many samples do you need?
Can we start small?
Send one carrier. Get a per-pin report back.
Start a validation: send one retired or in-service carrier with known abnormal pins, and Insightek returns a per-pin quantified report and an anomaly heatmap.